DHI has been working in collaboration with the Cedar Key Historical Society on their grant from the Florida Division of Historical Resources. The first stage of the project involves GIS analysis utilizing the Sea, Lake, and Overland Surges from Hurricanes (SLOSH) model developed by the National Hurricane Center at the National Oceanic and Atmospheric Association (NOAA). This model uses local landforms, tide information and storm data such as barometric pressure, wind speed, track data, and storm speed to anticipate where the worst impacts of storm surge might occur.
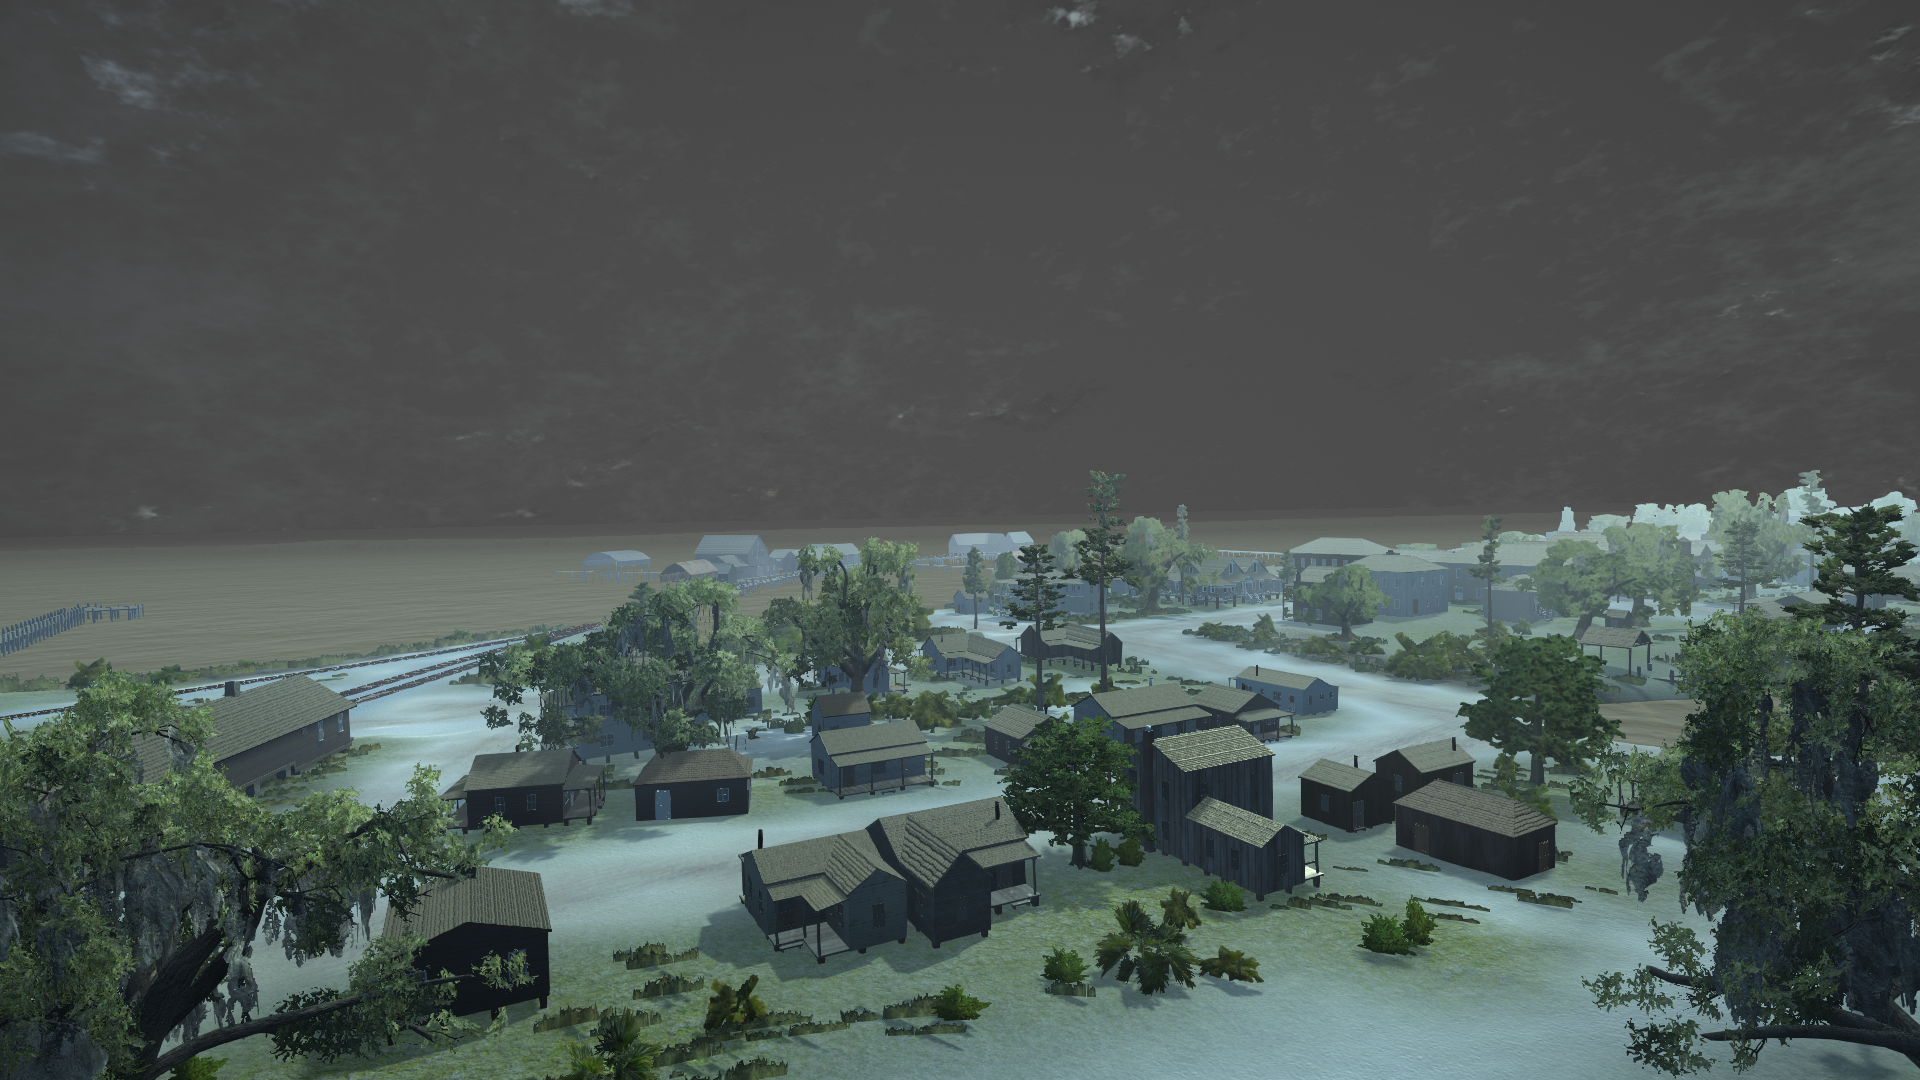
The second stage of the project involves creation of a virtual reality reconstruction of Cedar Key in 1920 that will serve as an educational and visual aid in discussing storm surge threat and impacts of past and future tropical cyclones.
| Possible Storm Surge Interactive Map |
|
|---|
Surge data was derived from the SLOSH Display Program provided by NOAA, which contains storm surge calculations from hypothetical hurricanes under different storm conditions. The results are Maximum Envelopes of Water (MEOWs) and the Maximum of MEOWs (MOMs). MEOWs provide a storm surge scenario of a potential storm’s intensity, track, directional speed, and whether its arrival onshore is at mean or high tide. It is important to note that these models are not representative of the flooding potential from any specific storm, because they represent a synthesis of historic and projected storm data.
MOMs are the worst-case scenarios of the MEOWs for each storm category (ie., tropical storm to category 5 hurricane). As with the MEOWs, no individual storm will produce the exact flooding seen in these results. The National Hurricane Center (NHC) regards MOMs as the optimal model for determining vulnerability and risk, and are used by municipalities across the country for hurricane evacuation planning.
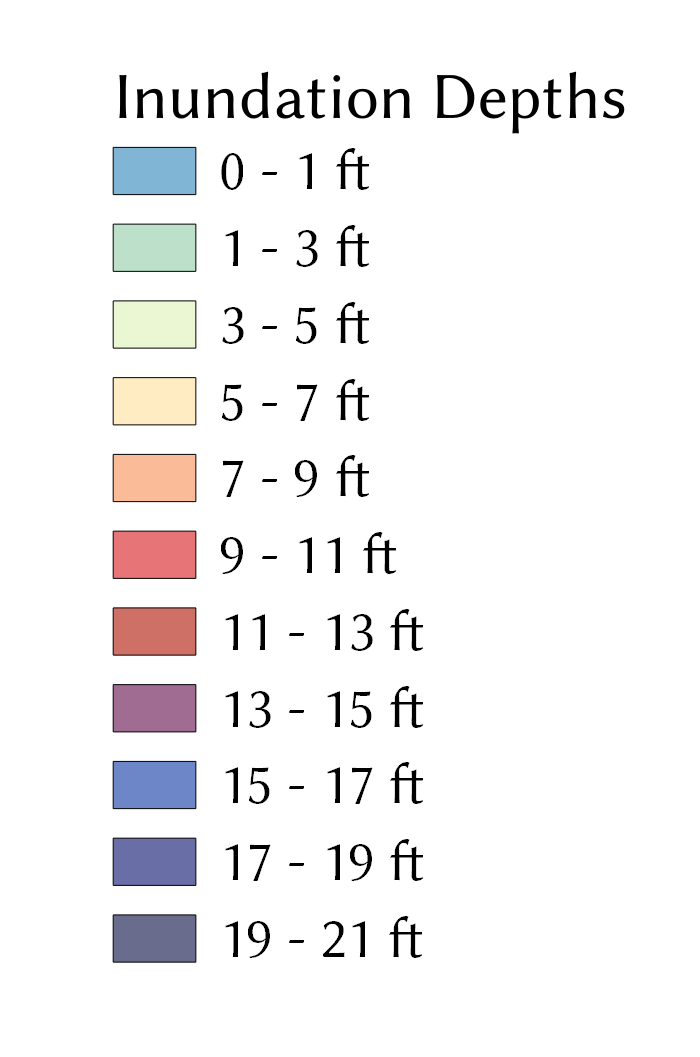
The goal of the analysis is to serve as an educational tool as well as determining which historical and archaeological sites are most vulnerable to storm surge. As such, the most suitable approach with SLOSH modeling was determined to be the Composite Approach, which uses a series of MOMs. The variables range from tropical storm to category 5 hurricane, and each category has results from mean tide and high tide. Each of the various MOMs were exported as shapefiles and combined with LiDAR data for Way Key. The MOMs shapefiles effectively show potential water height, or the top of water above mean sea level, for each storm category and tide. These heights are subtracted from the landscape to show storm surge depth information.
The interactive map shows the depth information for each category and tide with current historic structures in Cedar Key, represented by points and their Florida Master Site File number. They indicate which historic structures are most vulnerable to storm surge, and the potential depth of water that may threaten the structures. This depth information will also be combined a digitized 1920 Sanborn Map of Cedar Key to assist in producing the visualization for the forthcoming virtual world and storm surge animation. Updates are now available on the Virtual World tab above.